

Lake Powell water history
Every daily reading since the lake began filling in 1963: 22,968 readings, the latest on Nov 14, 2026.
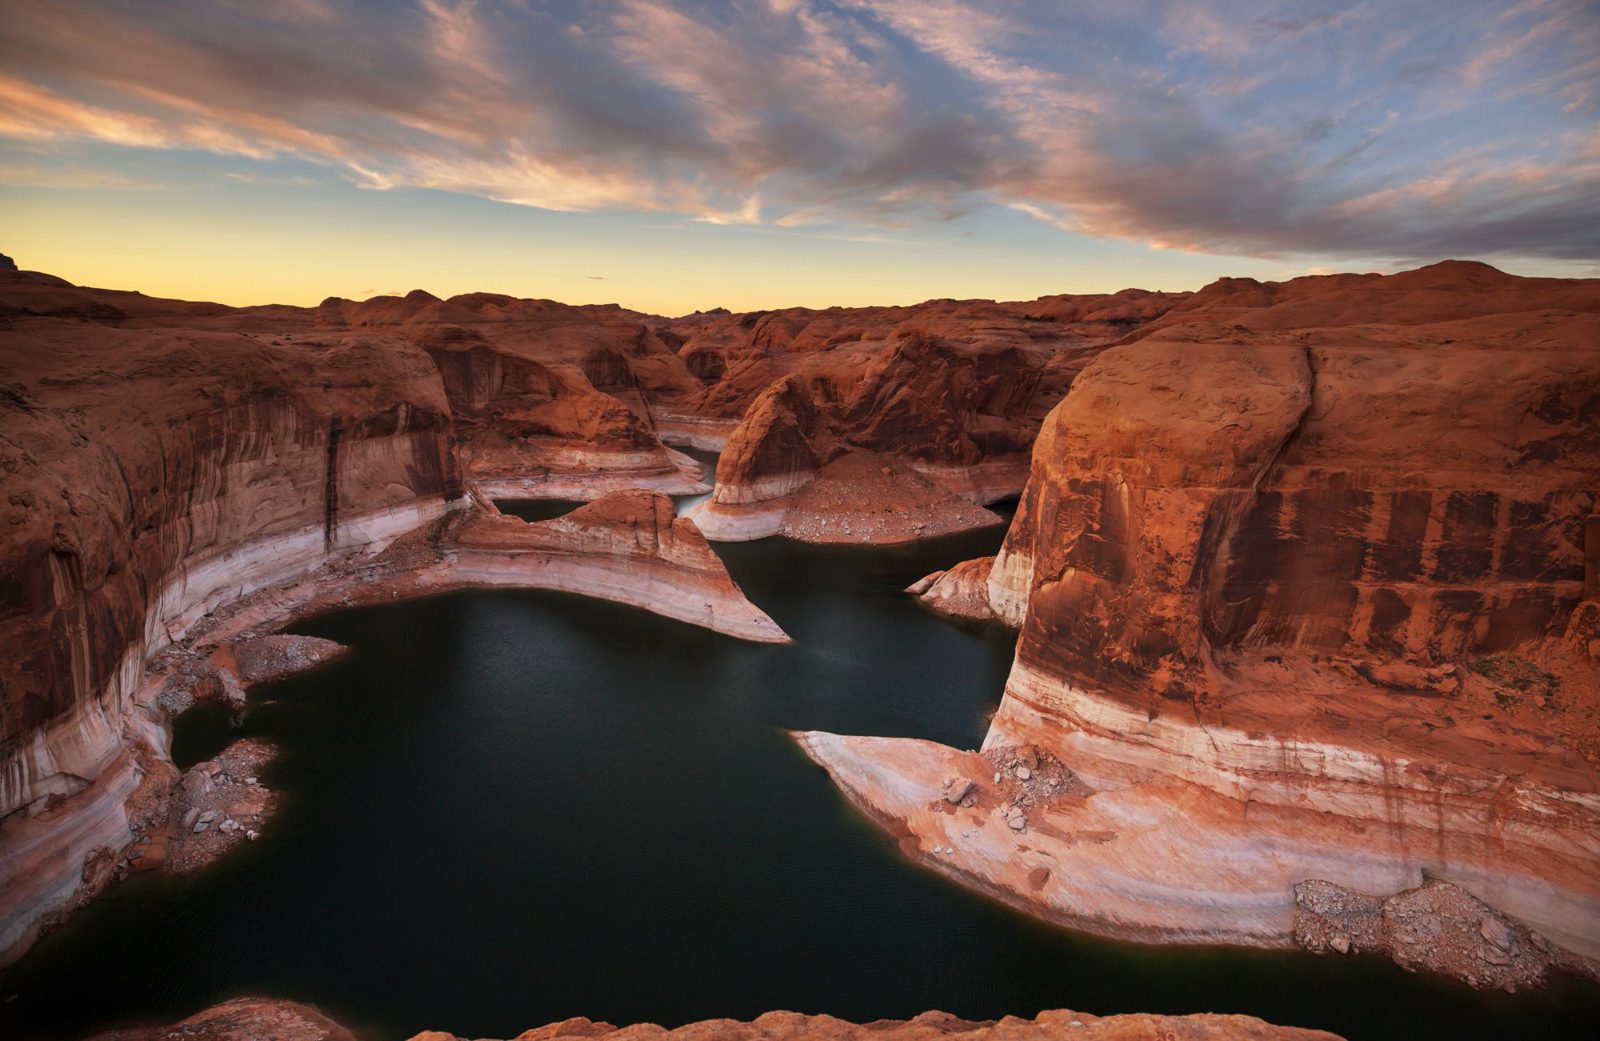
Reflection Canyon. The pale band on the cliffs is the "bathtub ring", left by higher water.
This year in context
In 2026 the lake didn't rise in spring at all (0.0 ft). Since 2000 a typical spring has added 16.3 ft; 2023 added 63.6 ft.
Spring rise is the highest reading from March through August minus the March starting level, using the nearest earlier reading when needed. The typical rise is the median of available complete years.
The record low since the lake first filled in 1980 was 3,516.62 ft on Sep 15, 2026.
No Aug–Dec since 1980 has seen a 30-day rise this big: +20.1 ft (previous best +12.0 ft, Aug 1995).
The all-time high was 3,708.34 ft on Jul 14, 1983. The latest level is above 4.9% of daily readings since the lake filled.
The lowest years since Lake Powell filled
These 5 years had the lowest daily readings since full pool was first reached on Jun 22, 1980.
| Year | Lowest level | Date |
|---|---|---|
| 2026 (so far) | 3,516.62 ft | |
| 2023 | 3,519.92 ft | |
| 2022 | 3,522.24 ft | |
| 2021 | 3,537.33 ft | |
| 2025 | 3,540.31 ft |
Ramps through the years
Each share counts observed days in the last 5 years when the lake was at or above its NPS minimum. Gaps are excluded; feet to go uses the latest reading on Nov 14, 2026.
NPS ramp minimums are currently unavailable.
NPS minimums only. A ramp can be closed above its minimum; current status is on the Boating page.
Year by year since 1980
Daily lows and peaks for 47 years. The unfinished year is marked “so far”; tied readings use the first date.
Every year’s low and peak
| Year | Low | Low date | Peak | Peak date |
|---|---|---|---|---|
| 2026 (so far) | 3,516.62 ft | 3,540.17 ft | ||
| 2025 | 3,540.31 ft | 3,571.83 ft | ||
| 2024 | 3,558.21 ft | 3,587.17 ft | ||
| 2023 | 3,519.92 ft | 3,584.68 ft | ||
| 2022 | 3,522.24 ft | 3,539.84 ft | ||
| 2021 | 3,537.33 ft | 3,582.06 ft | ||
| 2020 | 3,582.21 ft | 3,611.02 ft | ||
| 2019 | 3,568.51 ft | 3,621.68 ft | ||
| 2018 | 3,581.85 ft | 3,622.74 ft | ||
| 2017 | 3,593.85 ft | 3,635.80 ft | ||
| 2016 | 3,591.14 ft | 3,621.45 ft | ||
| 2015 | 3,589.82 ft | 3,614.32 ft | ||
| 2014 | 3,574.21 ft | 3,609.68 ft | ||
| 2013 | 3,584.43 ft | 3,609.62 ft | ||
| 2012 | 3,609.82 ft | 3,639.63 ft | ||
| 2011 | 3,609.70 ft | 3,660.90 ft | ||
| 2010 | 3,618.62 ft | 3,638.82 ft | ||
| 2009 | 3,609.70 ft | 3,642.30 ft | ||
| 2008 | 3,588.24 ft | 3,633.72 ft | ||
| 2007 | 3,594.64 ft | 3,611.68 ft | ||
| 2006 | 3,588.66 ft | 3,610.87 ft | ||
| 2005 | 3,555.10 ft | 3,608.38 ft | ||
| 2004 | 3,564.42 ft | 3,597.06 ft | ||
| 2003 | 3,597.22 ft | 3,619.94 ft | ||
| 2002 | 3,620.10 ft | 3,656.08 ft | ||
| 2001 | 3,656.17 ft | 3,673.02 ft | ||
| 2000 | 3,669.89 ft | 3,683.40 ft | ||
| 1999 | 3,677.20 ft | 3,694.73 ft | ||
| 1998 | 3,672.81 ft | 3,697.06 ft | ||
| 1997 | 3,663.08 ft | 3,695.09 ft | ||
| 1996 | 3,671.79 ft | 3,688.31 ft | ||
| 1995 | 3,644.59 ft | 3,693.75 ft | ||
| 1994 | 3,650.02 ft | 3,665.75 ft | ||
| 1993 | 3,612.46 ft | 3,668.70 ft | ||
| 1992 | 3,615.91 ft | 3,634.01 ft | ||
| 1991 | 3,624.55 ft | 3,639.02 ft | ||
| 1990 | 3,633.48 ft | 3,658.42 ft | ||
| 1989 | 3,658.46 ft | 3,679.73 ft | ||
| 1988 | 3,679.76 ft | 3,693.31 ft | ||
| 1987 | 3,677.47 ft | 3,698.47 ft | ||
| 1986 | 3,680.68 ft | 3,700.02 ft | ||
| 1985 | 3,674.82 ft | 3,700.12 ft | ||
| 1984 | 3,672.99 ft | 3,702.46 ft | ||
| 1983 | 3,682.01 ft | 3,708.34 ft | ||
| 1982 | 3,661.89 ft | 3,687.83 ft | ||
| 1981 | 3,667.47 ft | 3,681.38 ft | ||
| 1980 | 3,672.45 ft | 3,700.59 ft |
Source: USBR daily elevation record. Analysis by Lake Powell Now from USBR daily readings.
Not for navigation. Conditions change fast. Check the National Park Service before you launch.